
Navigating Music Catalog Valuations: Part II
Jumping Back Into the Music Catalog Debate
GM readers 👋,
Happy August! In this newsletter, we’re jumping back into the music IP valuation debate. I published a previous post on this topic in April. Since then, there have been several developments on the macroeconomic and music industry fronts. What are the dynamics at play? And how might they impact music catalog values in the future?
A fun part about writing this newsletter is that I get to learn in public. Sometimes folks reach out with positive feedback. Sometimes folks dunk on me when they know more than I do. But in the process, I get to meet some amazing new people and become smarter along the way. I’ve admired folks who have played similar online games like Packy McCormick at Not Boring and the amazing team at Naavik (who I’ve been lucky enough to collaborate with and learn from).
In my mind, this piece reflects a reward from the process of learning in public. I’m fortunate to be able to publish Leveling Up’s first collaborative blog with Justus Haerder. Justus knows a ton about music IP as the former EVP of Global Strategy and M&A at BMG, which is one of the leading international music companies and music IP buyers (and also partner to one of my favorite hip-hop artists – Logic). Justus has worked on a number of notable music IP deals including the Mick Fleetwood catalog transaction, the Tina Turner rights deal, the BMG and KKR partnership, and more. 💪
So, when Justus reached out with some helpful feedback on Leveling Up’s previous music IP piece, I asked if he wanted to join forces and write a Part II. The result is better and more in-depth than I could have hoped for. I think this 7.5k+ word piece can potentially serve as a valuable resource for industry participants considering a catalog sale or purchase as well as those simply wanting to learn more about the space.
We both hope you enjoy it! And as always, your feedback is welcome!
Now, on to the disclaimers…
Note: This piece is for informational purposes only. None of this is financial advice. Do your own research!
Thanks again for reading. Now, let’s get after it!
Jimmy
PS if you’re not already a subscriber to Leveling Up and don’t want to miss out on future newsletters, feel free to enter your email below and you’ll receive new posts directly in your inbox:
Navigating Music Catalog Valuations: Part II

“Intrinsic value can be defined simply: It is the discounted value of the cash that can be taken out of a business during its remaining life. The calculation of intrinsic value, though, is not so simple. As our definition suggests, intrinsic value is an estimate rather than a precise figure, and it is additionally an estimate that must be changed if interest rates move or forecasts of future cash flows are revised.” - Warren Buffett
TL;DR
There have been a variety of macroeconomic headwinds (inflation, rising interest rates, recession concerns) and industry tailwinds (higher industry growth forecasts, statutory rate changes in the U.S.) impacting music catalog valuations and M&A activity.
To fully understand how these developments affect valuations, it’s important to understand how investors value music catalogs.
While acquisition multiples are often quoted by industry participants, discounted cash flow (“DCF”) analysis is arguably the key method for valuing music catalogs.
As part of a DCF analysis, investors estimate future cash flows and their cost of capital, also known as the weighted average cost of capital (“WACC”).
To project cash flows, investors rely on the catalog’s historical trends, but the investor’s views of the future – how macroeconomic and industry trends might affect its earnings – are even more crucial.
Meanwhile, the WACC is not static and is currently increasing due primarily to macroeconomic factors.
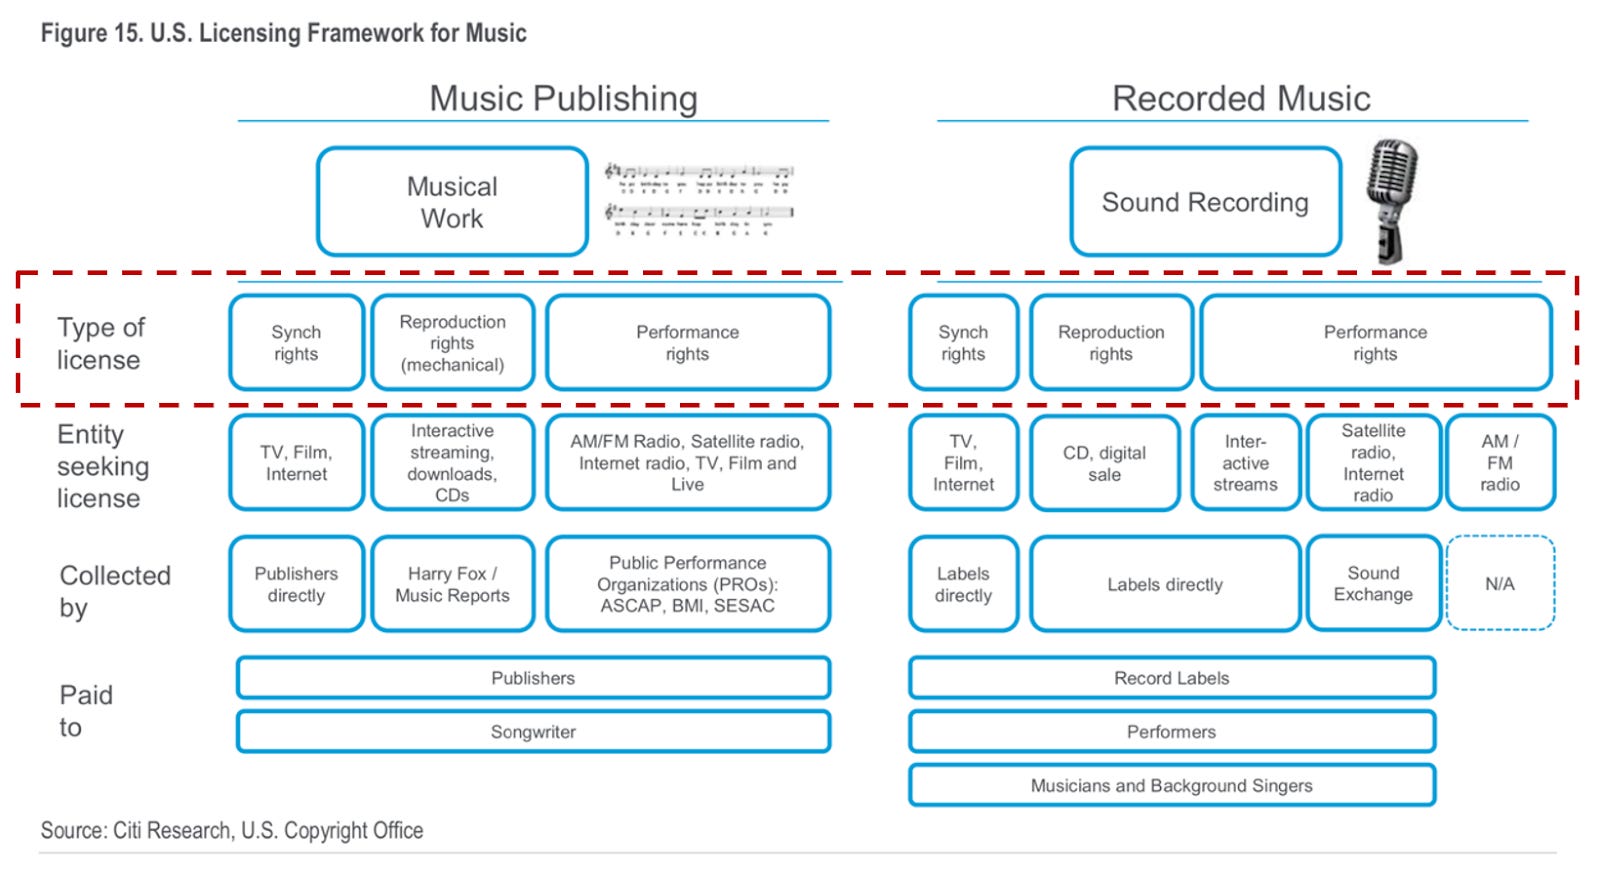
Each song in a catalog is made up of two copyrights – a master recording and a musical composition. These copyrights generate several types of income streams (e.g., streaming, mechanical, performance, synch), and each is impacted by macroeconomic and industry developments differently.
Based on Goldman Sachs’ recent industry outlook and our assumptions – which assume no change to the discount rate – we estimate that the average evergreen recorded music purchase multiple increased 0.5x to 1.0x (~3%). However, when we factor in a higher WACC primarily due to rising interest rates, we estimate that this purchase multiple declined 3.8x (~18%).
Based on Goldman Sachs’ recent industry outlook and our assumptions – where we already incorporate the CRB rate change and assume no change to the discount rate – we estimate that the average evergreen music publishing multiple increased 0.1x (~1%). However, when we factor in a higher WACC primarily due to rising interest rates, we estimate that this purchase multiple declined 3.3x (~19%).
In short, while music catalog valuations benefit from an improved industry outlook, our analysis suggests that these tailwinds are more than offset by rising interest rates.
That said, each music catalog is unique and each investor is different. Underwriting assumptions vary, so take our analysis and its insights with a healthy grain of salt.
While our calculations suggest music IP multiples may decline 15% to 20%, this is in-line with the year-to-date decline in publicly traded music stock prices (e.g., Hipgnosis, Universal, Warner) and is significantly lower than declines in other sectors like software.
Despite our analysis suggesting that music valuations could decrease on average in the near-term, the music IP asset class still has several positives going for it. In short, we both remain bullish skeptics in the current environment.
Introduction
In April, Leveling Up covered the potential impact of rising interest rates on the music IP market. We argued that low interest rates were one of the major drivers causing the surge in music catalog valuations and M&A activity over the past few years. But we noted that this trend was in the process of changing. A couple of months later, Goldman Sachs released an update to its terrific Music In the Air series and seemed to have a similar perspective:
“The low interest rate environment drove a surge in catalog acquisition multiples. However, in the current environment, with higher inflation driving rising interest rates, we believe that valuations and size of transactions may start to come down.”
In addition to Goldman’s updated industry forecast, a lot has happened over the past few months. The macroeconomic backdrop has gotten cloudier, while the music industry’s outlook is arguably brighter. Let’s recap some highlights of all the recent news flow:
U.S. inflation has persisted. The Consumer Price Index increased 9.1% year-over-year in June and reached its highest level in 40 years.

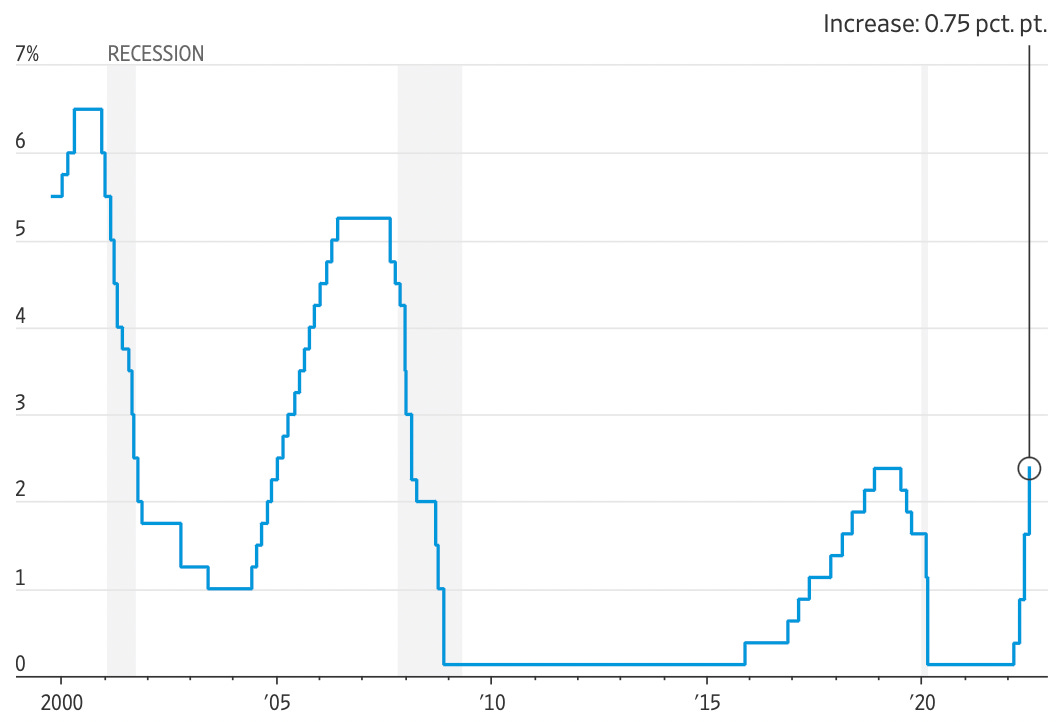
Interest rates continue to increase. To combat rising inflation, the U.S. Federal Reserve announced its largest rate hike in 28 years, increasing its target short-term interest rate (depicted below) from 0.25% - 0.5% in April to 2.25% - 2.5% now. Fed policy makers now expect rates to reach 3.4% by the end of 2022, whereas April projections for year end rates were only 2%. Meanwhile, the 10 year U.S. Treasury yield has risen from 1.5% at the beginning of 2022 to 3.1% as of July 2022. This is important because the 10 year Treasury is a common proxy for the risk-free rate in discounted cash flow models (something we will break down in detail later).
Global recession concerns have grown. Wall Street strategists and economists think that a U.S. and global recession is becoming more likely amidst rising interest rates and weakening economic indicators.
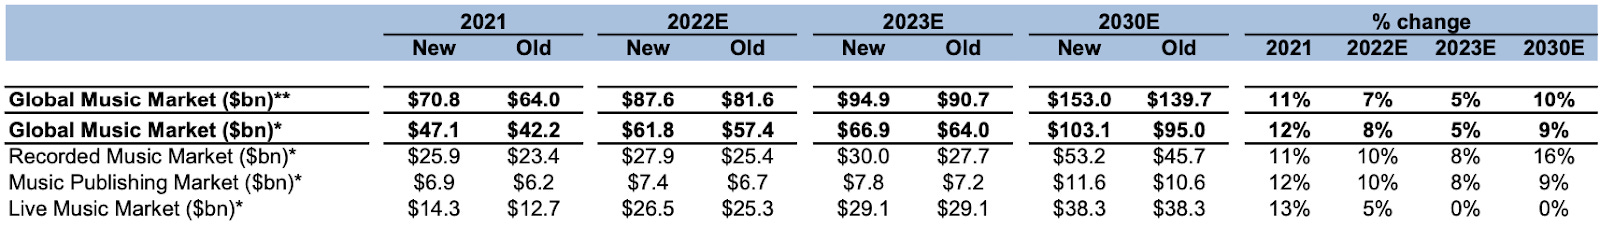
Meanwhile, global music industry growth forecasts were increased. As mentioned, in June, Goldman Sachs released an update to its highly influential Music In The Air series, in which it increased its 2030 forecast for the size of the global music market by 10% to $153 billion. Ad-funded streaming and streaming subscription ARPU drove the increase in Goldman’s forecast. It’s worth noting that Goldman’s projections did not yet incorporate the Copyright Royalty Board’s decision to increase mechanical on-demand streaming rates.
Music publishing rights holders received two positive statutory rate developments in the U.S.
First, the Copyright Royalty Board (“CRB”) maintained its decision to increase the mechanical royalty rate paid to songwriters and publishers in the U.S. from on-demand streaming services. The rate will increase from 10.5% to 15.1% between 2018 to 2022, implying these rights holders can expect a 10% to 44% annual increase from this income stream versus the prior rate regime. For context, the National Music Publishers Association reported that 18.5% of total U.S. publishing revenue was derived from mechanical royalties (which includes other sources than on-demand streaming) in 2021.

Second, publishers and labels reached a settlement to increase the mechanical statutory rate for U.S. physical sales. The Copyright Royalty Board was sent a settlement agreement for approval that increases the royalty rate paid to songwriters and publishers on U.S. physical (e.g., CDs) and download sales for the first time since 2008. If approved by the CRB, the settlement would result in a 32% rate increase from 9.1 cents to 12 cents per track. And going forward, this rate will automatically adjust each year based on the rate of inflation, as measured by the Consumer Price Index.
Given all these developments, we thought that it would be interesting to dive back in and try to make sense of the various moving parts. We begin this essay by discussing the drivers of discounted cash flow methodology – the key methodology for music catalog valuations. From there, we’ll estimate the quantitative impact of recent developments on valuations. While the estimating process simplifies aspects of the analysis, as do some high-level assumptions you’ll see below, we believe that it can still be directionally helpful. After establishing the key drivers and looking at the macro factors impacting them, we estimate how they will affect recorded music and music publishing multiples. To help guide readers who are new to catalog valuation, we’ve open sourced a simplified discounted cash flow model linked here.
Our hope is that this piece can be a helpful resource for music industry participants – whether they be creatives, managers, executives, or investors – wanting to better understand how buyers value music catalogs and how they might be impacted in today’s environment.
How Do Investors Value Music Catalogs?
Before diving into the numbers, let’s start with the basics of music catalog valuation. There are several methodologies used to value music catalogs. However, the two most common are: 1) a multiple of the last twelve month’s cash flows (i.e., a purchase multiple) and 2) a discounted cash flow analysis.
Many in the music industry like to reference purchase multiples as the primary valuation metric. They are commonly highlighted in press releases and quarterly earnings reports. And sellers often have a multiple in mind when they start exploring a catalog sale. But in my (Justus here!) experience, ALL music catalog buyers heavily rely on a different valuation methodology to arrive at their price. They use a discounted cash flow (“DCF”) model.
So, what is a DCF model and why is it a common way to value music IP catalogs? To help guide this discussion, consider a famous quote from legendary investor Warren Buffett, “Price is what you pay. Value is what you get.” In other words, a discounted cash flow model enables a music catalog buyer to determine what price they are willing to pay, based on their assessment of a catalog’s future cash flows (i.e., value) – their size, timing, and riskiness.

There are several assumptions that drive a DCF analysis, but two are key in our view. The first relates to the forecasted future cash flows, specifically how much and when the project’s cash flows are expected to be realized. The other important driver of a DCF model’s valuation is the investment’s cost of capital, also referred to as the “WACC” or “discount rate” (we will talk about this in detail later). The discount rate reflects the risk associated with the expected cash flows (i.e., an investor’s confidence in their estimates), as well as the capital sources used to fund the investment. If an investment is considered to be higher risk, its cost of capital (or WACC) will be higher. The opposite is true if an investment is considered to be lower risk. Here’s the mathematical formula used to calculate a DCF valuation:

If you’re not already familiar with DCF analysis, the above formula may look a bit daunting. But let’s walk through the key drivers – cash flows (“CF”) and discount rate (“dr”) – necessary to value a catalog. To do so, we’ll break the process down into three steps:
Forecast the catalog’s future earnings
Make adjustments to future earnings in order to calculate the catalog’s cash flows
Calculate the discount rate & value the catalog
Step 1: Forecast a Catalog’s Future Earnings
In order to estimate future cash flows, most buyers typically start by looking at the catalog’s past earnings. When analyzing these historic earnings, an investor will weigh several considerations in order to estimate future earnings in their DCF model. Some of these questions include:
How much has the catalog earned in the previous 3 to 5 years?
How is the catalog’s earnings split by income type (e.g., streaming vs. download vs. physical vs. synchronization (“synch”) for master catalogs or mechanical vs. performance vs. synch for publishing catalogs)?
Have there been any one-off items that need to be normalized (e.g., unusually high synch or one-off distributions of catch-up payments)?
Has it grown below, with, or above the market? Has it grown below, with, or above comparable assets?
How can I increase earnings by better administration, exploitation, and monetization?
How long will the earnings last? Are termination rights or reversion rights a concern?
In addition to these catalog-specific factors, future earnings could also be impacted by macroeconomic and industry trends. Some questions in this category include:
What market growth rates do I believe in (e.g., Goldman Sachs’ industry forecast) and how will the catalog I am looking at perform relative to the market in the future?
Will the catalog repertoire increase its market share or will new repertoire replace the catalog over time?
Could potential regulatory changes (e.g., the CRB ruling) improve future earnings? How much will earnings be impacted if these changes happen?
These are just a handful of questions that an investor might ask when trying to estimate the future earnings of a catalog. But, as you can probably tell, investors put a large amount of weight on past performance to project the future.
When it comes time to forecast future earnings, most investors feel comfortable forecasting a catalog’s earnings for 5 to 10 years, in our experience. As a general rule of thumb, investors have more confidence in estimating future earnings for catalogs that have demonstrated a history of consistent, stable earnings. At the same time, many leave undecided regulatory changes in their “back pocket” as additional upside, choosing not to factor them into estimated earnings.
How Is Each Catalog Income Stream Potentially Impacted by Current Events?
Now that we’ve explored the basics behind projecting earnings in a DCF model, we think that it’s important to note how each catalog income stream is driven by different macroeconomic and industry factors. Having a firm grasp on these drivers is crucial when estimating a catalog’s future earnings.
Along these lines, each catalog is made up of a collection of songs. Each song is made up of two copyrights – a master recording (audio recording of the song) and a musical composition (lyrics, melody). These copyrights generate royalties from different types of usage. Master recording income types include streaming, digital download, physical, and synch. Meanwhile, music publishing income types include performance, mechanical, and synch. So, even though many people consider music IP to be an “uncorrelated asset class”, that is not entirely true once we dig deeper into the different income types that drive music IP earnings. Simply put, each income type is impacted by macro and industry factors differently.
For recorded music IP, most investors currently assume that future streaming income from digital service providers (“DSPs”), like Spotify and Apple Music, will largely be uncorrelated with the broader economy. In other words, forecasted earnings from DSPs are typically assumed to remain stable or grow, even if the economy cools down slightly. On the other hand, most investors assume that future physical sales will be meaningfully impacted by lower consumer spending, because these royalties are often derived from higher priced vinyl and box-set sales. Synch earnings are more case-by-case. Synch income can often be impacted by an economic recession because it is dependent on advertising and content (e.g., film, TV) budgets, which may be reduced. At the same time, buyers with the capability to actively manage catalogs will consider their ability to potentially increase future synch earnings. So, when investors project future earnings, they often weigh the catalog’s past synch income trend with their ability to increase it in the future, and consider scenarios where synch placement of the respective catalog is less frequent and/or lower in value per synch.
For music publishing IP, the same logic applies for estimating future synch earnings as that for recorded music IP. Mechanical earnings primarily consist of streaming and physical usage, so the considerations for estimating future earnings are similar to that for recorded music’s streaming and physical sales. For publishing’s performance earnings, we need to dig a bit deeper into the drivers. A severe recession in major economies will likely lead to lower advertising spending, resulting in lower performance license fees paid by broadcasters (in territories where performance license fees are tied to advertising revenues) to music rightsholders. This will typically reduce the overall performance income available for publishing assets, which will negatively impact catalog earnings. For example, CISAC, the organization of global collection societies, reported that music collections declined 11% in 2020 due to the pandemic.
As you can see, each royalty type has its own drivers. Even though a recession may negatively impact some of these income streams, there are also several positive industry trends supporting the future growth of music IP cash flows, which are not reflected in most catalog’s historic earnings figures. In my (Justus here!) opinion, the two most prominent examples are developing markets and emerging technologies. Goldman Sachs’ most recent industry outlook assumes that emerging markets will see 14% paid streaming penetration by 2030 (vs. 40% in the US today). So, while the potential growth from emerging markets is already factored into the respective overall market growth rates, some investors might believe that there is room for upside and have a more positive view on how a particular catalog might benefit from these markets.

The same holds true for emerging technologies. Music has seen a proliferation of usage across new media and interactive platforms over the past decade. Whether it’s video services (e.g., Youtube) or more direct music platforms (e.g., Spotify), the music market is probably as healthy as it’s ever been in the digital era. More recently, new social media platforms, such as TikTok, and fitness platforms, such as Peloton, have contributed to the growth of the music industry. And new digital platforms are launching every year with little to no cannibalisation of revenue from existing platforms. And lastly, the “metaverse” – the buzzword du jour – is coming. These virtual worlds provide artists and rights holders with exciting new opportunities. For example, Travis Scott reportedly grossed $20 million and reached ~28 million users during his virtual Fortnite concert. A remarkable feat! Some music IP investors are already taking a view on how these digital platforms might impact certain catalogs’ earnings in the future. That said, most of the same investors will not include the potential future earnings from more nascent technologies in their base case (i.e., the case that supports their offer) earnings estimates.

In short, there are many considerations that go into an investor’s forecast of a catalog’s future earnings. The catalog’s past performance is very important, but the investor’s views of the future – how macroeconomic and industry trends might affect its earnings – are also crucial. Regardless, once the catalog’s earnings have been forecasted, an investor can move on to Step 2 in the DCF process.
Step 2: Make Adjustments to Earnings to Calculate Cash Flow
Step 1 enabled us to estimate a catalog’s earnings. Now, we need to make a few adjustments to arrive at the cash flows, which drive our valuation. After all, a DCF model is called discounted cash flow analysis for a reason. In other words, investors are arriving at the purchase price based on the cash flow – not earnings – they expect to get back. While earnings form the basis for cash flows, investors have to incorporate taxes and other adjustments which impact the cash flow that they ultimately receive. For example, if the purchase is structured as an asset deal (as opposed to an equity purchase), an investor can typically amortize the catalog’s purchase price over a set period of time, thereby reducing the cash taxes owed. After factoring in these adjustments, an investor can calculate how much cash the catalog will generate over the forecast period.
At the end of the forecast period, some investors assume the catalog is sold. Other investors continue to project the earnings and cash flows of the catalog based on some terminal growth rate (typically between 0% to 3%, in our experience) per year. This is called the catalog’s “terminal value”. With all the forecast period cash flows and the terminal value in hand, an investor is ready to move on to the final piece of the DCF puzzle – the discount rate.
Step 3: Calculate the Discount Rate & Value the Catalog
We will discuss the discount rate (also known as the WACC) in more detail later in this piece. The WACC is used to “discount” an investor’s estimated cash flows back to today to arrive at a purchase price. It is determined by what an investor owes their capital providers in exchange for providing the capital (equity or debt) to fund the purchase price.
Capital providers are looking for a return when investing in music IP assets, just like any other investor is looking for a return when making an investment. The level of return that investors are expecting from music IP is driven by several factors, including:
How much of the purchase price can be funded with debt (which is typically cheaper) versus equity?
What return can investors expect in other asset classes (e.g., risk-free Treasuries, corporate bonds, public equities, private equity, private credit), especially those with similar risk?
It’s important to note that the WACC is not static. It changes based on the macroeconomic environment, the amount of debt vs. equity used, the interest rate environment, and the perceived riskiness of the music IP asset class vs. the broader market.
As it relates to the macroeconomic environment, greater uncertainty causes capital providers to have a lower risk tolerance, to demand a higher return, and to be less willing to provide credit for music catalog purchases. For example, in my (Justus here!) experience, some buyers could fund 30% to 75% of a music catalog’s purchase price with relatively low cost debt a year ago. Today, raising debt is more difficult and expensive.
Meanwhile, the high inflation environment has forced central banks around the globe to increase interest rates. Up until recently, interest rates were low and the cost of capital was cheap. Accordingly, a lot of debt and equity capital was available to buy music IP. One could argue that the low interest rate environment was one of the main drivers for increasing music IP valuations and deal activity. However, the recent rising interest environment has made debt and equity more expensive, impacting catalog valuations.
To illustrate the impact of rising return expectations, consider a simple example. Assume you are promising to pay somebody $110 in one year, they would be willing to give you $100 now if his return expectation is 10%. But if they now require a 12% return, they would only be willing to give you ~$98.
Similarly, many buyers who borrow money to fund catalog purchases pay interest to their lenders based on a floating interest rate. This interest rate (typically tied to 3 month LIBOR in our experience) has increased dramatically over the past 6 months. This means that catalog buyers have less cash flow to acquire new catalogs and/or to distribute to their equity investors. In both cases, the key point is that the cost of money (i.e., the discount rate) is currently increasing. We will go into much more detail on calculating the discount rate / WACC below.
Regardless, once we have it in hand, we can now discount the estimated cash flows calculated in Step 2 and arrive at a catalog valuation! Hopefully you’re not looking at us like we’re Charlie from Always Sunny in Philadelphia at this point. 😉

After calculating a valuation, investors will typically run more optimistic and pessimistic scenarios. This “sensitivity analysis” is done by changing key DCF model variables, such as the discount rate or the catalog’s long-term growth, and enables investors to gauge the impact on valuation from small changes to assumptions.
With all this analysis in hand, an investor is ready to make an offer on the catalog!
A Short Note On Purchase Multiples…
Hopefully you now have a better understanding of why most investors rely on a DCF model – instead of purchase multiples – to value a catalog and how many investors approach a catalog valuation. That said, we realize that it’s a complex topic if you’re not already familiar.
To potentially add a bit of context, here’s a simple example of why investors typically rely on a DCF relative to other valuation methodologies like purchase multiples. Imagine you have two catalogs with the exact same characteristics (e.g., the same genre, last twelve months of earnings, number of songs, income sources, etc.), except one catalog is 15 years old and the other is 2 years old. The 15 year old catalog demonstrates stable earnings from year-to-year, whereas the 2 year old catalog is demonstrating a typical initial decline in earnings. Based on this description, an investor would likely expect very different future earnings from these two catalogs. In other words, an investor would expect to receive more cash flows from the older, more stable catalog.
In summary, purchase multiples only provide so much information about a catalog. While investors do typically consider multiples during their evaluation process, they typically rely more heavily on DCF models, in our experience. This is because the DCF methodology enables the investor to more rigorously determine what price they should pay for each catalog compared to other valuation methodologies, such as purchase multiples.
How Might Recent Developments Impact Valuations?
Now that we’ve explained the basics of catalog valuation and how investors typically approach it, let’s open up Microsoft Excel to estimate the potential quantitative impact of recent macro and industry changes on catalog valuations. In addition to the below analysis, we are also open sourcing a Google Sheet linked here where you can see a simple discounted cash flow (“DCF”) model. Our hope is that this will foster a better understanding for how music catalog valuations work; some of the drivers impacting value; and how investors arrive at a purchase price.
Along these lines, we’ve tried to make this section approachable for individuals from a variety of backgrounds. We hope that the open sourced model will help guide your review. And we’d love to hear your questions and feedback – good or bad – so feel free to post your comments below.

Finally, here’s an important disclaimer about the below analysis: Each music catalog is unique and each investor is different. Underwriting assumptions vary, so take this analysis and its insights with a healthy grain of salt.
Higher Industry Growth Forecasts
First, how does Goldman Sachs’ new industry forecast potentially impact valuations? As a reminder, some music catalog buyers use “Wall Street'' industry forecasts to underwrite catalog cash flows, especially for older, evergreen catalogs. And Goldman’s music industry report is arguably the most followed among Wall Street banks. For example, Hipgnosis disclosed it incorporated Goldman Sachs’ 2019 industry estimates into its valuations for catalogs with a weighted average age older than 10 years.
So, let’s pretend that we are a buyer who underwrites Goldman's industry forecast. We’ll explore how the change to Goldman’s industry growth assumptions might impact both master recording and music publishing catalog valuations. But as another reminder, in my experience (Jimmy here!), often individual catalog steady-state growth rates are lower than industry growth rates. This is because industry growth rates take into account new content (i.e., songs) coming into the system, whereas static catalogs do not. However, I (Justus here!) have seen some evergreen catalog growth rates exceed market growth, so it’s very much a case-by-case analysis.
For recorded music, Goldman Sachs increased its 2030 industry estimate by 16%. The increase was driven by 11% higher industry revenues in 2021, a 32% increase in the ad-funded streaming revenue forecast, and a slower than previously forecasted decline in physical sales. Higher streaming and physical income estimates resulted in a 8.3% CAGR (versus the previous 7.7% CAGR) forecasted between 2021 and 2030. CAGR, which stands for Compound Annual Growth Rate, essentially reflects the “average” annual growth rate to get from point A (2021) to point B (2030). While the individual growth rates between 2021 and 2030 might be high or lower than 8.3%, the “average” is 8.3%. Here’s a comparison of Goldman’s new and old recorded music industry growth rates by year:
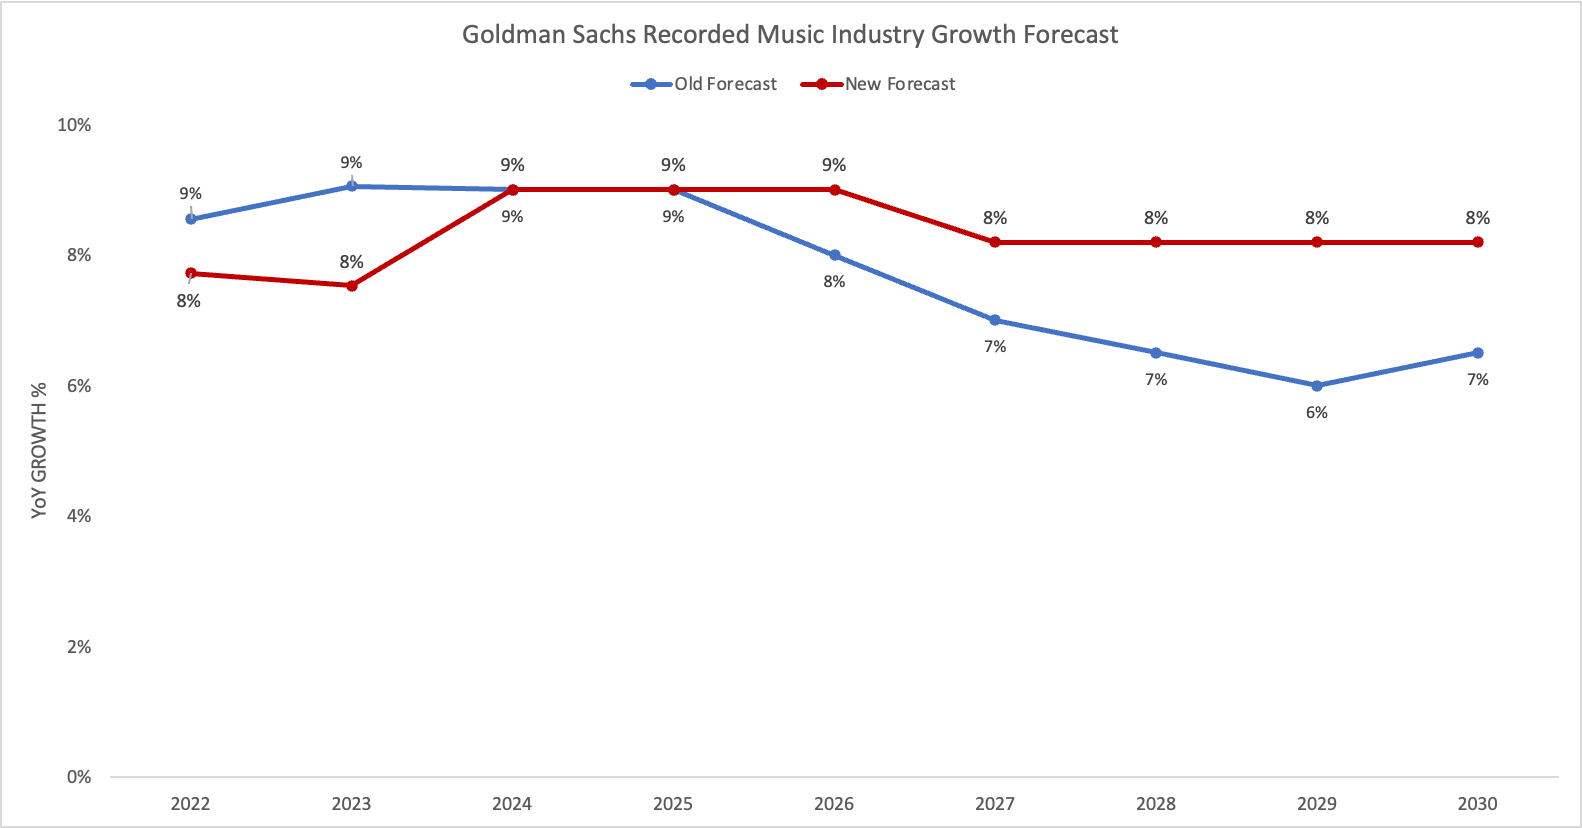
Goldman now expects recorded music industry growth to be slower in 2022 and 2023, butoff a higher base now. Therefore and despite the slightly slower growth, Goldman’s new 2022 and 2023 industry estimate is 10% and 8% higher, respectively. The biggest changes to the bank’s estimates were its 2026 to 2030 growth rates, which were raised from 6%-7% to 8%-9%.
To visualize the impact of Goldman’s updated forecast, let’s assume we underwrite a recorded music catalog with $100 of last twelve months’ (“LTM”) earnings and apply Goldman’s new and old industry growth estimates. Typically we would forecast by each song’s individual income stream type, but we are simplifying in our illustrative example.

The impact of the change in growth rates is slightly lower earnings in 2022 through 2026 and then higher earnings thereafter. Of course, we are ignoring that our LTM figure in the new forecast is likely higher now than it would have been previously. After all, the recorded music industry’s strong results in 2021 is a driver in Goldman’s decision to update its forecasts. Nevertheless, let’s calculate a present value of cash flows using the following DCF assumptions:
Buyer’s Tax Rate = 30% in both cases
Weighted Average Cost of Capital (“WACC”) = 8.1% in both cases
The purchase price can be amortized straight-line over 10 years in both cases
Terminal Cash Flow Growth Rate = 2% in both cases
Ignores the possibility of termination and reversion rights
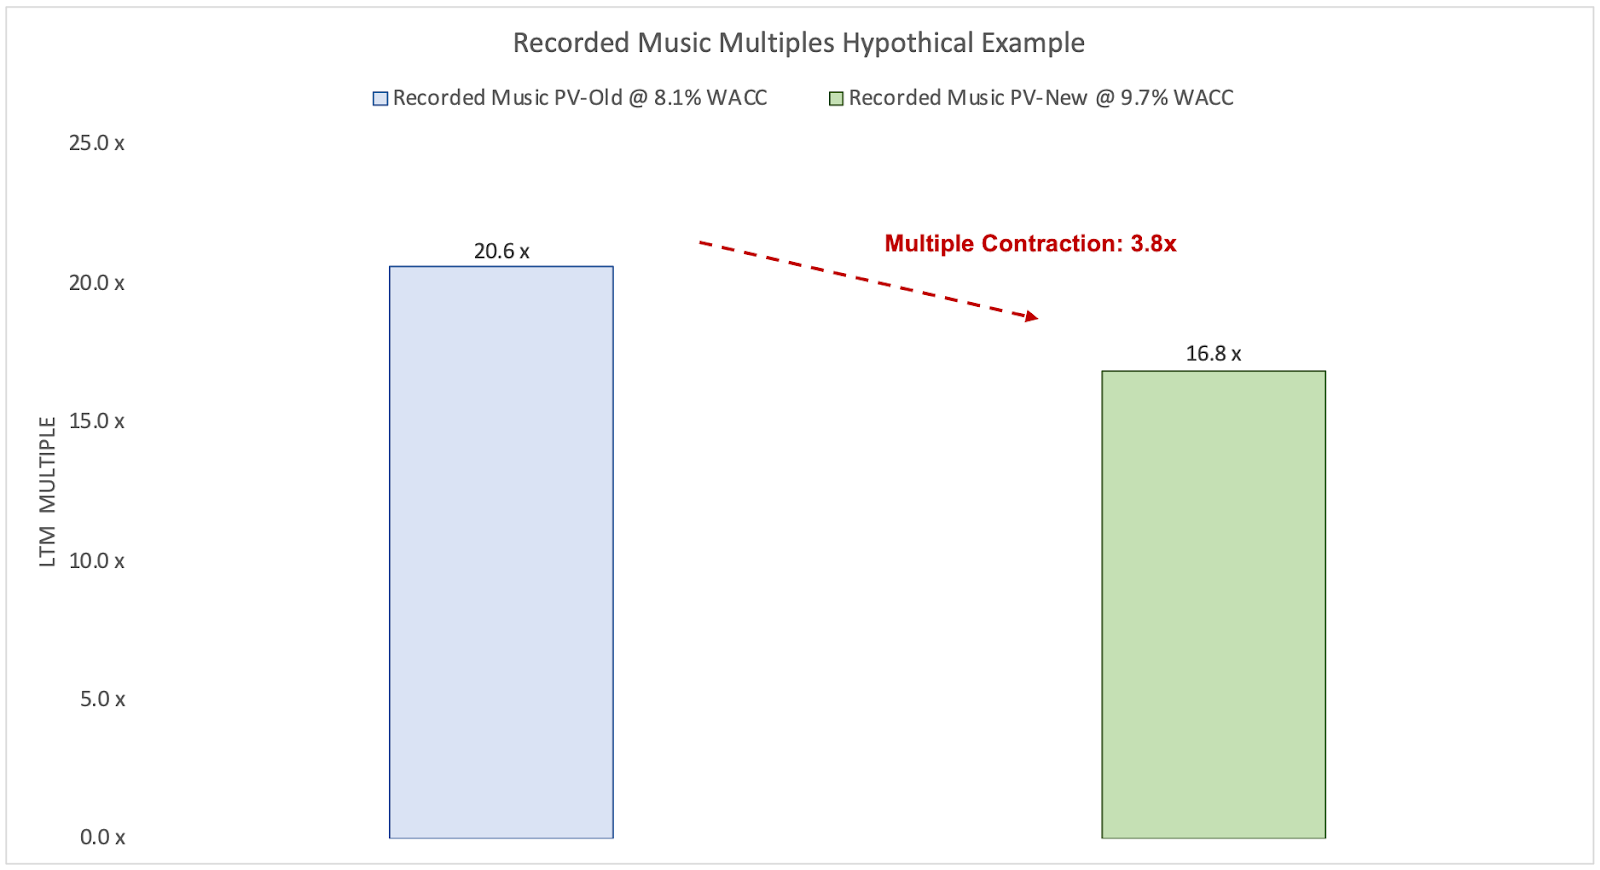
Based on these assumptions, we calculate a present value of $2,064 or a 20.6x LTM multiple in the Old Case and a present value of $2,125 or 21.3x LTM multiple in the New Case. Simply put, our assumptions suggest Goldman’s updated report results in multiple accretion of 0.7x for recorded music catalogs, assuming no change to the discount rate. We’ll examine how changes to cost of capital may impact valuations shortly.
Let’s shift our focus from recorded music to publishing catalogs. Goldman Sachs increased its 2030 publishing industry estimate by 9%. The increase was driven by 12% higher industry revenues in 2021, in addition to increases to physical mechanical and streaming royalties. However, Goldman counterintuitively decreased its publishing growth CAGR between 2021 and 2030 from 6.2% to 6.0%. This was driven by the fact that Goldman decreased its growth forecasts between 2022 to 2024 from 7%-8% to 5%-6%. From 2027 to 2030, the bank raised its growth forecasts from 5% to 6%. For buyers that rely on Goldman’s estimates to underwrite valuations, this latter change will potentially result in increased terminal growth rates (and hence, terminal values) when underwriting publishing catalog purchases. Here’s a comparison of Goldman’s new and old music publishing industry growth rates by year:

It’s worth noting that Goldman factored in the recent increase in U.S. physical mechanical royalty rates from $0.091 to $0.12 into their forecast. However, as previously mentioned, the bank published its new forecast before the CRB announced it will be maintaining the increase to U.S. on-demand streaming mechanical rates from 10.5% to 15.1%. So, what might an updated forecast look like?
To calculate the potential revision to Goldman’s projections, we need to estimate how U.S. on-demand streaming mechanical royalties impact its global publishing market estimates. For the U.S. component, we know that Spotify generated 38% of its revenue in the U.S. in 1Q 2022. We’ll use that as a proxy, while acknowledging it’s just one on-demand streaming service. For the on-demand streaming component, Goldman’s June 2022 report indicated that digital mechanical revenue will make up roughly 20% to 35% of the global publishing market between 2022 and 2030 (image depicted below). Let’s use that as an approximation for on-demand streaming, while acknowledging that a portion of digital mechanical revenue is unrelated to on-demand streaming.

After combining the below assumptions, we are left with a low-end and high-end estimate for how Goldman Sachs’ global publishing estimates may be revised further upward due to the CRB rate change:
The 44% increase to the go-forward U.S. on-demand streaming mechanical rate multiplied by;
Our assumption that 38% of on-demand streaming revenue is generated in the U.S. multiplied by;
Our assumption that 20% to 34% of publishing revenue is derived from digital mechanical royalties.
Low-End Estimate: 44% x 38% x 20% = 3% incremental growth
High-End Estimate: 44% x 38% x 34% = 6% incremental growth
We estimate that Goldman may increase its global publishing projections a further 3% to 6% due to the recent CRB decision. For our internal modeling, we assume that Goldman will revise its global publishing forecast a further 3% higher in 2023 to take into account the CRB decision. It’s important to note that the change to individual publishing catalog valuations will vary based on the percentage of income derived from U.S. on-demand streaming mechanical royalties. Again, our analysis is illustrative and not catalog specific.
To visualize these updated forecasts, let’s assume we underwrite a catalog with $100 of last twelve months’ (“LTM”) earnings and apply Goldman’s old and new music publishing industry growth estimates. In addition, we’ll include a third case named “Leveling Up”, which incorporates our assumptions around the CRB’s mechanical rate decision. We typically would forecast by each song’s individual income stream type, but we are simplifying in our illustrative example.

The impact of the change in Goldman’s growth rates (ignoring the Leveling Up Case) surprisingly results in slightly lower publishing earnings in our example. This is driven by the reduced CAGR over the forecast period. Of course, we are ignoring that the LTM figure in the new forecast is likely higher now than it would have been previously. Regardless, once we incorporate the CRB rate decision, this results in higher earnings. Let’s calculate a present value of cash flows using the following DCF assumptions:
Buyer’s Tax Rate = 30% in both cases
Weighted Average Cost of Capital (“WACC”) = 8.1% in both cases
The purchase price can be amortized straight-line over 10 years in both cases
Terminal Cash Flow Growth Rate = 1.5% all three cases
Ignores the possibility of termination and reversion rights
Based on these assumptions, we calculate a present value of $1,782 or a 17.8x LTM multiple in the Old Case and a present value of $1,742 or 17.4x LTM multiple in the New Case. Simply put, our assumptions – which assumes no change in the discount rate – suggest Goldman’s updated report results in a slight decrease in valuation multiples for music publishing catalogs. That said, once we incorporate higher growth rates due to the CRB on-demand streaming mechanical rate change, we calculate a present value of $1,792 or 0.1x multiple accretion in our illustrative example.
In summary then, Goldman Sachs’ updated industry forecast results will likely result in many buyers tweaking their underwriting model growth rates higher, especially those for older, evergreen catalogs. This is especially true for recorded music catalogs, as Goldman increased their 2021 to 2030 CAGR to 8.3% from 7.7% previously. Interestingly, music publishing catalog models likely benefited less from Goldman’s updated forecast. The investment bank actually slightly lowered the CAGR over the forecast period to 6.0% from 6.2% previously. When we combine our illustrative catalog cash flows with discounted cash flow assumptions, we estimate that Goldman’s new industry forecasts result in 0.5x to 1.0x multiple accretion for our illustrative steady-state recorded music catalog valuations and flat to 0.5x multiple accretion for our illustrative music publishing catalog valuations.
Finally, it’s worth noting that Goldman’s estimates do not anticipate a significant impact on music spending from a potential recession or higher inflation. A deeper than expected recession or stagflationary environment will likely cause Goldman to revise its estimates lower. Along these lines, catalogs that are driven by performance or synchronization income, which are often tied to advertising and marketing spend, would likely be more negatively impacted in a recessionary environment. Meanwhile, in a scenario with accelerating inflation, publishing catalogs that are driven by income streams subject to the U.S. statutory rate setting process are likely to more slowly adjust to the impact of inflation. We’ll be watching how the macroeconomic environment plays out over the next 12 months to better gauge these potential impacts on music catalogs and industry forecasts.
Higher Discount Rates
In the previous section, we focused on the impact of higher cash flows on music catalog valuations. Now, let’s turn our attention to another major driver of valuations: discount rates (as mentioned before, also known as the weighted average cost of capital or “WACC”).
Before diving into the numbers driving discount rates, let’s level-set on how buyers typically think about their WACC. We think it’s important to quickly differentiate between three types of acquirers:
Publicly-listed labels and publishers: In our opinion, these buyers have some advantages over other types of buyers. Their relationships, infrastructure, access to cheaper public market capital, and other capabilities typically allow these buyers to have the lowest cost of capital. Given the size of their businesses, they are usually focused on larger catalog acquisitions. Examples include Universal, Warner, and Sony.
Publicly-listed catalog aggregators: These buyers typically purchase existing music royalty catalogs with a stable history of income. Unlike major labels and publishers, aggregators do not spend as much time and capital on finding and breaking new artists and songwriters. Instead, these funds typically acquire cash flowing catalogs and then pass through this cash flow to their shareholders. However, like labels and publishers, these aggregators do try to take an active role after acquiring a catalog by attempting to increase the catalog’s cash flow and decrease expenses. Like the publicly-listed labels and publishers, catalog aggregators’ cost of capital is ultimately determined by public investors. However, given their primary focus on catalogs, aggregators’ cost of capital can differ from labels and publishers depending upon the state of the market. Examples include Hipgnosis Songs Fund and Round Hill Music Royalty Fund.
Private market buyers: This category is broad, including both traditional labels and publishers as well as private catalog aggregators. Its cost of capital is less easily observable. For private labels and publishers, the cost of capital can often mirror that of publicly listed labels and publishers. But for private catalog aggregators, the cost of capital depends on where they are sourcing their capital. For example, catalog aggregators typically raise capital from high net-worth individuals and institutional investors such as pension funds, private equity firms, and hedge funds. Aggregators promise these investors a minimum return on their equity capital (e.g., 10%-12% or higher) over a period of time (e.g., 5-10 years). Private market buyers’ business plan often includes “exiting” by issuing shares to public equity investors or selling to bigger buyers (i.e., publicly-listed labels or bigger aggregators). Some pundits make the case that these private buyers’ valuations are less influenced by swings in the cost of capital because their promised return to investors is agreed upon and locked-in for an extended period. We’d push back on this. Private managers want to preserve the relationship with their investors, so that they can raise future funds. Along these lines, if the institutional investors, who fund private market buyers, can earn the same return on music catalog assets in the public markets, then they will likely shift their capital to public company securities that are more easily tradable or require a greater rate of return from private managers in order to commit their capital for an extended period of time. Similarly, the underwriting models used to value catalogs often put a meaningful amount of value on the catalog’s future sale price. If the rate of return required by public market buyers (the end buyer of many private market catalogs) goes up, the assumed price of that future catalog sale will go down, all else equal. As a result, private market buyers’ cost of capital and valuations are still inherently linked to that of public market buyers. Examples of private market buyers include Kobalt, BMG, Concord and Primary Wave with respect to publishers and labels as well as Tempo (backed by Providence Equity), HarbourView (backed by Apollo), KKR, Hipgnosis Songs Capital (backed by Blackstone), and Litmus Music (newly backed by Carlyle) with respect to aggregators.
With that context in mind, let’s analyze how music catalog discount rates are calculated and how recent developments have impacted them. This section will be academic at times, so thanks in advance for bearing with us 😊. And again, this is an illustrative and generalized example. It should be taken with a healthy grain of salt!
Our discount rate calculation will be derived from the below formula:
Discount Rate or WACC = (Cost of Equity x % Equity) + (Cost of Debt x % Debt)
Let’s break this formula down further, starting with the cost of debt because it’s easier than the cost of equity.
Calculating the Cost of Debt
The cost of debt is calculated by:
Observing the buyer’s yield-to-maturity (i.e., rate of return required by debt holders) on its long-term debt multiplied by; and
1 minus the buyer’s tax rate.
For our hypothetical example, let’s use the BofA BBB-rated corporate bond index yield as a proxy for the cost of debt and assume our buyer’s tax rate is 30%. At the beginning of 2022, the index’s yield was 2.7%, implying an after-tax cost of debt of 1.9%. As of July 2022, the index’s yield has nearly doubled to 5.2%, implying an after-tax cost of debt of 3.6%. In short, our example suggests the buyer’s after-tax cost of debt has increased 170 basis points year-to-date.

Calculating the Cost of Equity
Let’s now shift to calculating the cost of equity. We’ll use the Capital Asset Pricing Model (“CAPM”). This model basically says that equity investors require a certain amount of return over the risk-free rate to hold riskier assets. This extra risk is called the “equity risk premium” and is equivalent to the risk premium of the market as a whole multiplied by “beta”, a measure of the riskiness of a specific investment relative to the market. So, our cost of equity calculation looks as follows:
Equity Cost of Capital = Risk-Free Rate + (Beta x Equity Risk Premium)
The risk-free rate, especially for a U.S. domiciled buyer, is often derived from the yield on the U.S. 10 year treasury note. We’ll use this proxy for our illustrative example. Since the beginning of 2022, this yield has increased from 1.5% to 3.1%.
A buyer’s beta is calculated using the below formula. It’s important to note that a buyer’s beta and cost of equity increase as its total percentage of debt financing increases (i.e., the more you pay for your investment with debt, the higher the risk for your equity). In our illustrative example, we derive the Unlevered Beta from Professor Aswath Damodaran at NYU, who observed a 0.96 unlevered beta for Entertainment companies. We’ll assume the catalog is financed via a 30% loan-to-value ratio, implying equity makes up the remaining 70% of the purchase price. And again, we assume a 30% buyer’s tax rate. After combining these assumptions, we calculate a 1.25 levered beta. It’s fair to question whether this beta is too high. I’ve (Jimmy here!) written in the past about how music spending has been uncorrelated with broader consumer spending. In addition, Yahoo reports that Hipgnosis’ levered beta is only 0.25. Nevertheless, we’ll rely on Professor Damodaran’s data in our example.
Levered Beta = Unlevered Beta + [1 + (1 - tax rate) x (Debt / Equity)]
The equity risk premium is backward looking and varies over time. We’ll use Professor Damodaran’s current calculation of equity risk premium for the trailing 12 months at 5.7%.
For our hypothetical example, let’s compare the cost of equity at the beginning of the year to the cost of equity in July 2022. Based on the above formula, we estimate:
Cost of equity in January 2022 = 1.5% + 0.96 x 5.7% = 8.6%
Cost of equity in July 2022 = 3.1% + 0.96 x 5.7% = 10.2%
In short, our example suggests that the buyer’s cost of equity has increased 160 basis points year-to-date.
Calculating the Discount Rate
With our cost of debt and cost of equity in hand, we can now calculate the discount rate or WACC for this illustrative example:
As of January 2022, our buyer’s WACC was: 6.6% = 1.9% (after tax cost of debt) x 30% + 8.6% (cost of equity) x 70%
By July 2022, our buyer’s WACC had risen to: 8.2% = 3.6% (after tax cost of debt) x 30% + 10.2% (cost of equity) x 70%
However, it’s important to consider if these discount rates appropriately incorporate the illiquid nature of most music catalog assets. In our current discount rate calculation, we are using data for securities (e.g., publicly traded stocks and corporate bonds) that are more easily tradable than most privately held music catalogs. As a result, we’d argue that an “illiquidity discount” needs to be incorporated into our discount rate calculation. In other words, this is the additional return that buyers require as compensation (i.e., the opportunity cost) for holding illiquid investments.
To estimate the amount of additional return required, we relied on a recent Pimco study that concluded illiquidity discounts of 1.5% to 2% are reasonable for the average illiquid investment. After adding 1.5% to 8.2%, we arrive at an adjusted WACC of 9.7% as of July 2022 versus 8.1% at the beginning of the year. Our WACC calculation is depicted below and can also be found in the open-source Google Sheet.

Measuring the Impact of Higher Growth vs. Higher Discount Rates
As we discussed above, the higher discount rate results in lower catalog valuations. But does it more than offset the better outlook for growth rates in our example? To figure this out, we used the following methodology. First, we calculated a valuation for our hypothetical example using Goldman’s “old” (i.e., previous) industry growth rates for both recorded music and music publishing. Then, we discounted these cash flows at the 8.1% WACC from the beginning of 2022.
We repeated the exact same steps except using the “new” (i.e., most recent) industry growth rates and discounting the cash flows at the 9.7% WACC that we estimate using current market data. Finally, we compared these two values for both recorded music and music publishing to see if multiples have expanded or contracted.
Our results are depicted below. In both our recorded music and music publishing examples, higher discount rates more than offset the higher growth rates. For recorded music, which saw purchase multiples expand by 0.7x (from 20.6x to 21.3x) prior to any change in discount rate, we now calculate 3.8x multiple contraction.
For music publishing, which saw purchase multiples increase 0.1x prior to any change in the discount rates, we now calculate 3.3x multiple contraction.

In summary, our analysis suggests that the negative impact of rising interest rates on valuations has exceeded recent revisions to industry growth, resulting in overall lower valuations and multiples. In our illustrative examples, we see recorded music and publishing catalog multiples contracting 15% to 20%. For context, Hipgnosis, Universal, and Warner have seen their stock prices drop 9%, 13%, and 26%, respectively, year-to-date. Meanwhile, public software as a service (“SaaS”) multiples have contracted 50%+ from early 2022. So while we see some music catalog valuation contraction, it is in-line with publicly-listed music IP companies and significantly less than other sectors have experienced.

It’s also important to note that our examples are generalizing. The assumptions driving them will not be the same for every catalog or buyer type. Certain catalogs may warrant higher growth assumptions. Meanwhile, certain buyers may have a lower discount rate. We are also assuming catalogs grow at Goldman’s industry average growth rates – an assumption that I’m (Jimmy here!) skeptical about in most cases. Even still, we’d argue that our analysis can still be instructive directionally when thinking about the current trend of music catalog valuations.
Final Thoughts
Hopefully this piece provides market participants with a better understanding of the key drivers of catalog valuations, as we see them. Despite the somewhat negative tone of this essay, we are both quite bullish on music catalogs as an asset class. Music is an essential good and we believe that the long-term outlook for the industry is bright. Indeed, there aren’t many $10+ billion industries growing at nearly 10% per year. Similarly, music’s lower correlation to broader economic activity and the recurring, consistent nature of music royalties are very attractive, especially relative to other asset classes. In short, we are both bullish skeptics in the current environment.
At the same time, greater uncertainty will likely lead to lower valuations in the near- to intermediate-term. We would not be surprised to see less music IP fundraising than seen in the last 2 to 3 years, some newer buyers potentially leaving the space, and some long-standing buyers potentially ramping up activity. Whereas the market has favored sellers for the past few years, the pendulum may be swinging to greater equilibrium between sellers and buyers. The next 12 months promises to be a fascinating one for music catalog M&A and we will certainly be paying close attention.
Thanks to Hannah and Adam for the feedback, input, and editing!
Thank you for this insightful article Jimmy! This is a good illustration how industrial investors approach when valuing the music assets. I am also a new joiner and currently having a hard time working with the royalty statements with all different formats and huge quantity. Any tips you might provide on data cleaning?